
Data Analytics Online Live Class by Experts
Our Training/Internship Process

Data Analytics - Syllabus, Fees & Duration
-
Learn Python Program from Scratch
- Basic programming concepts
- Object -oriented programming
- Data types, variables, strings, loops, and functions
- Software engineering using Python.
-
Statistical and Mathematical Essential for Data Science
- Collection, classification, and analysis of data
- A foundational part of Data Science
- Explain measures of central tendency and dispersion
- comprehend skewness, correlation, regression, distribution
-
Data Science with Python
- Jupyter Notebook and PyCharm based lab environment
- Machine Learning
- Data visualization
- Web scraping
- Natural language processing
-
Database
-
Machine Learning
- Mathematical and heuristic aspects
- Hands-on modeling to develop algorithms
- Advanced Machine Learning knowledge.
-
Data Analytics with R:
- Data wrangling
- data exploration
- data visualization
- predictive analytics
- descriptive analytics techniques
- import and export data in R
- data structures in R
- various statistical concepts
- cluster analysis
- forecasting
-
Visualization with Tableau
- Data Visualization
- combo charts
- working with filters
- parameters
- sets
- building interactive dashboards
-
Visualization with Power BI
- Data filtering
- Data manipulations
- understanding the patterns in data
- create customized dashboards with powerful developer tools
Technologies Training:
-
Python:
- Introduction to Python and Computer Programming
- Data Types
- Variables
- Basic Input -Output Operations
- Basic Operators
- Boolean Values
- Conditional Execution
- Loops
- Lists and List Processing
- Logical and Bitwise Operations
- Functions
- Tuples
- Dictionaries
- Sets
- Data Processing
- Modules
- Packages
- String and List Methods
- Exceptions
- File Handlings li> Regular expressions
- the Object - Oriented Approach: Classes, Methods, Objects
- Standard Objective Features; Exception Handling
- Working with Files
R:
- R Introduction
- Data Inputting in R
- Strings
- Vectors
- Lists
- Matrices
- Arrays Functions and Programming in R
- Data manipulation in R
- Factors
- DataFrame
- Packages
- Data Shaping
- R-Data Interface
- Web Data and Database
- Charts-Pie
- Bar Charts
- Boxplots, Histograms
- LineGraphs
- Mean
- Median
- Mode
- Regression-Linear
- Multiple
- Logistic
- Poisson
- Distribution-Normal
- Binomial
- Analysis-Covariance
- Time Series, Survival
- Nonlinear Least Square
- Decision Tree
- Random Forestc
MySQL
- MySQL – Introduction
- Installation
- Create Database
- Drop Database
- Selecting Database
- Data Types
- Create Tables
- Drop Tables
- Insert Query
- Select Query
- WHERE Clause
- Update Query
- DELETE Query
- LIKE Clause
- Sorting Results
- Using Joins
- Handling NULL Values
- ALTER Command
- Aggregate functions
- MySQL Clauses
- MySQL Conditions
Matplotlib:
- Scatter plot
- Bar charts
- histogram
- Stack charts
- Legend title Style
- Figures and subplots
- Plotting function in pandas
- Labelling and arranging figures
- Save plots.
Seaborn:
- Style functions
- Color palettes
- Distribution plots
- Categorical plots
- Regression plots
- Axis grid objects.
NumPy
- Creating NumPy arrays
- Indexing and slicing in NumPy
- Downloading and parsing data Creating multidimensional arrays
- NumPy Data types
- Array attributes
- Indexing and Slicing
- Creating array views copies
- Manipulating array shapes I/O.
Pandas:
- Using multilevel series
- Series and Data Frames
- Grouping
- aggregating
- Merge Data Frames
- Generate summary tables
- Group data into logical pieces
- manipulate dates
- Creating metrics for analysis
- Data wrangling
- Merging and joining
- Data Mugging using Pandas
- Building a Predictive Mode.
Scikit-learn:
- Scikit Learn Overview
- Plotting a graph
- Identifying features and labels
- Saving and opening a model
- Classification
- Train / test split
- What is KNN? What is SVM?
- Linear regression
- Logistic vs linear regression
- KMeans
- Neural networks
- Overfitting and underfitting
- Backpropagation
- Cost function and gradient descent, CNNs
Tableau
- Tableau Architecture
- File Types
- Data Types
- Tableau Operator
- String Functions
- Date Functions Logical Functions
- Aggregate FunctionsvJoins in Tableau
- Types of Tableau Data Source
- Data Extracts
- Filters
- Sorting
- Formatting
- Adding Worksheets and Renaming Worksheet In Tableau
- Tableau Save
- Reorder and Delete Worksheet
- Charts
- dashboard.
Power BI
- Power BI Architecture
- Components
- Power BI Desktop
- Connect to Data in Power BI Desktop
- Data Sources for Power BI
- DAX in Power BI
- Q & A in Power BI
- Filters in Power BI, Power BI Query Overview
- Creating and Using Measures in Power
- Calculated Columns
- Data Visualizations
- Charts
- Area
- Funnel
- Combo
- Donut
- Waterfall
- Line
- Maps
- Bar
- KPI
- Power BI Dashboard
This syllabus is not final and can be customized as per needs/updates
- Since 2001, Making IT Experts by Experts
- Duration: 70 Hours (Vary as per your skill)
- Course Fees
- Individual Live Classes (1:1)
- Batch Classes @ Low Fees
- Training on Your Time, Any Where
- Access to Recorded Videos
- Practical Internship on Projects
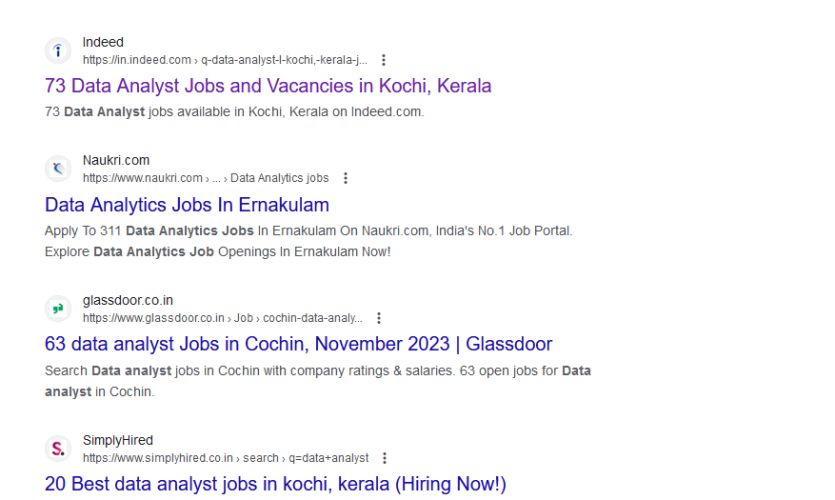
- 100% Placement Support by our jobsNEAR.in
- Training/Internship Certificate
- Adelaide
- Albany
- Alice Springs
- Armidale
- Ballarat
- Bathrust
- Bendigo
- Brisbane
- Bunbury
- Busselton
- Cairns
- Canberra
- Central Coast
- Darwin
- Devonport
- Dubbo
- Geelong
- Geraldton
- Gold Coast
- Goulburn
- Hobart
- Launceston
- Lismore
- Melbourne
- Melton
- Mildura
- Newcastle
- Nowra
- Orange
- Perth
- Rockhampton
- Shepparton
- Sydney
- Tamworth
- Toowoomba
- Townsville
- Warrnambool
- Wollongong
Course Highlights

Our Locations

 Here are some common components of a data analytics course:. These courses are offered by various educational institutions, including universities, online platforms, and specialized training providers. Here is a step-by-step guide to help you get started with data analytics training: Remember that practice is essential in data analytics. Work on real-world projects, participate in online competitions (such as Kaggle), and continue learning to enhance your skills. Data analytics training involves acquiring the knowledge and skills needed to analyze and interpret data to make informed business decisions. A data analytics course is an educational program designed to teach individuals the skills and knowledge needed to work in the field of data analytics. The content of data analytics courses can vary, but they typically cover a range of topics related to collecting, analyzing, and interpreting data to extract valuable insights.